How Engineers would describe what a Load is.
What is Load?
What is actually a load? How do we measure it in Application systems?. How does big giants like Netflix, Uber, Twitter and Amazon would describe their load? And How did it affect them ?.
Yes there are some key metrics and things that we have to know to describe loads. And practical examples to describe or measure the loads.
The PS brothers
RPS
Requests Per Second : How many Requests that system handles per second?
A server handles incoming client requests, processes them, and may invoke downstream services as part of the flow. The efficiency of this pipeline directly affects response time. Edge servers are often the most impacted in this architechture(Front row to the war of requests), as they serve as the entry point for traffic and must handle high concurrency under varying load conditions.
But most probably the App servers can be scalled with adding more servers to handle the load as much as possible since it has Linear or Pool based topology. Even though it is important to make sure to handle most of the RPS by application code itself.
To be precise the RPS is totaly dependent on the Application logic, Programming language and the specifications of the server itself.
It may be also affected by Database calls, Network latency and other service/API calls.
CloudFlare uses GO based edge servers(Actually cloudfare is built on GO), able to handle 22K+ RPS per node.
QPS
Queries Per second: How much Queries that a system can handle?
Hmmm... That does sound like RPS but the R replaced with Q.
Actually it is almost the same as the RPS but one level down to the Databases. Actually Applications will process the request faster than the Databases. Because all the App servers are running on Memory(It's so simple). And database have to be slow, since persistence(Disk based) is slow.
Why RPS is different from QPS?
Because let's say a Request setting 3 queries with SELECT, UPDATE and DELETE... OK lets do the math.
1 RPS = 3 QPS
100 RPS = 300 QPS
10K RPS = 30K QPS
It is actually different from scaling the App server. Because we need to use startergies, components like Redis, Sharding to make sure it scales to that much of requests.
Twitter got 300K DB read req/sec in 2012. They used Redis to cache out the entire feed for users(Home Timeline). It caused Fanout issues in User posts(Writes in DB). Users like Ronaldo has millions of followers, so If Ronaldo post a picture it needs to be cached to millions followers cache caused Fan out issue.
TPS
Transactiosn per second. How much transactions are being done per second?
What is this man? another same concept with just taking out the Q and placing T???
But transactions are not only for a Database, it is a logical unit of work. It may requires buisness logic too... Measuring Transactions per second is not easy. And it depends on the transaction. Consider a Bank with a money transfer transaction and an user filling out the details in a form for his new college, each transaction has its own understanding.
If you compare it with RPS or Active users, you can also map with transactions. So in some buisness logics if you can able to figure out RPS, then you can able to figure out the TPS.
So finally to compare with QPS,
QPS measures database workload at the query level(Even TPS can also be measured, postgres uses TPS bencharking for conccurency), while TPS measures business-level throughput. Since a single transaction can involve multiple queries and requires consistency guarantees, TPS is typically much lower and harder to scale compared to QPS.
For more insights and how to calculate TPS in real time, check this link.
Speed vs Greed (Packets Edition)
Latency vs Throughput (They never get along).
Latency
Okay, when does an actual request reach the app server? And when does the request get replied to? We usually measure this in terms of time. We humans are always trying to make things faster (not everything though ;-)).
The simple explaination would be :How much time(delay) will it take for a water droplet to travel the whole pipe?
The time it takes for a request to travel from the client and reach the server and then for the response to come back, is what we call latency. It’s not just one step; it includes network travel, server processing, and the response path.
But we can’t limit this idea to just one use case. The same concept applies across layers. For example, in a database: how long does a query take to respond to the application? That is also latency.
So whether it’s a client talking to a server, or an application talking to a database, it all falls under the same umbrella: time taken to complete a request-response cycle.
Actual Companies will measure their latency(or time delay) with Just taking the medians and play them. So How to calculate them?
The server request will vary with respect to any Latency that we could get,
- Caused by n/w RTT or packet loss
- Caused by message queue slowness.
- Caused by bad page read or page fault in memory, need to get from disk.
- Caused by context switch of a background process.
- Or Even from the physical vibrations from Server rack. (Crazy....)
SO it is better to plot with N number of requests.
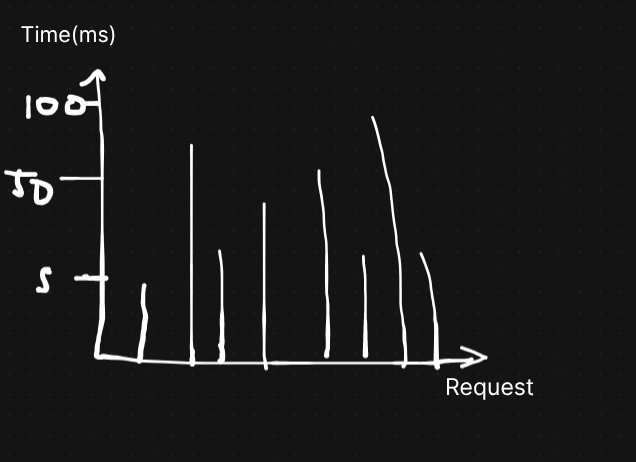
Best way to calculate the delays is to have a median value and and an average value.
Average : It is pretty simple just the average of the all time delays. It might not help that much it can easily tell how good is your system.
If you want to know how perfect, go for medians.
Medians : Sort the times and take the exact 50th of the request , where that is the median.
The median(50th value) mentions the requests will have 50% lower values in the right and higher in the right. It tells any request may fall on the both sides. 50% fast or 50% slow.(p50)
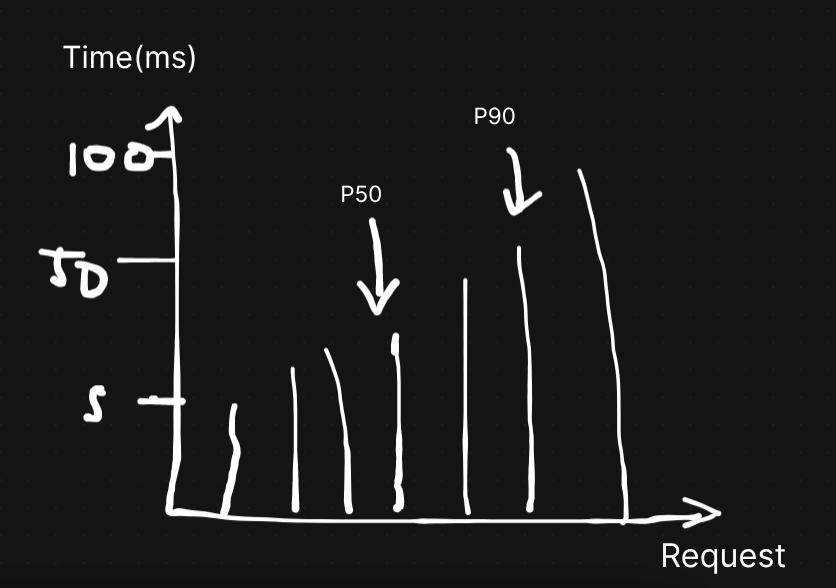
(p90) Where the 10 packets are the slowest of all the 100. Which is a good measurement to take where to have a greater insight of the reqs.
For example p90 is 2 sec. and the median is 100ms (see the difference, pretty bad) That some requests are getting delayed even after 2sec. So the system is having some issues in processing different requests at the same time or having concurrency bottle necks.
90th consideration is p90 and 99th is p99 and 99.9th is p999
For example, Amazon describes response time requirements for internal services in terms of the 99.9th per‐ centile, even though it only affects 1 in 1,000 requests. This is because the customers with the slowest requests are often those who have the most data on their accounts because they have made many purchases
Amazon has also observed that a 100 ms increase in response time reduces sales by 1% and others report that a 1-second slowdown reduces a customer satisfaction metric by 16%
Source: Designing Data intensive-applications
An SLA may state that the service is considered to be up if it has a median response time of less than 200 ms and a 99th percentile under 1 s (if the response time is longer, it might as well be down).
And Delays can be introduced due to Head of line blocking, (Mostly in Message queues), Consider a large message is processed, the subsequent queues might get the delay for them.
Tail latency-amplification: Backend needs to have a good response time , because when a client req is being processed it will be contacted to other microservices. So, if any of them fails to have a good response time, the whole request is getting delayed.
RTT(Round Trip Time)
What is this ?
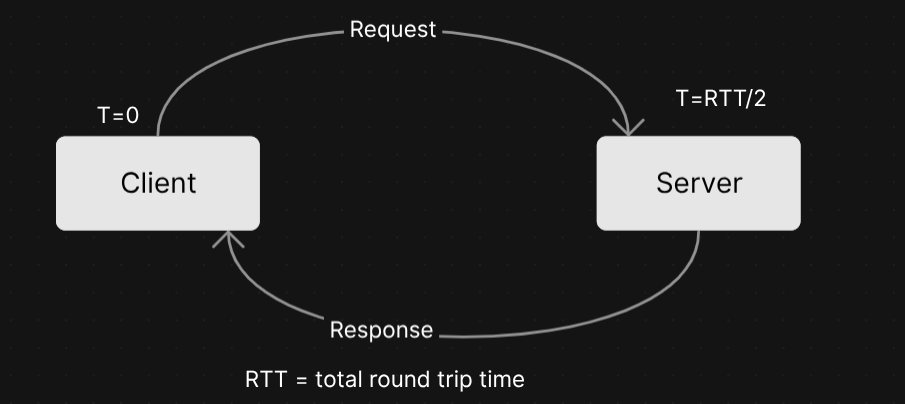
It is the network delay from moment they try to hit the request and the response from the server. It pretty much sounds the same but it is quite different
Latency = 2(RTT) + sever/system processing
The server processing time won't be considered here. Since RTT is only used to find the N/W time delays. The server/system processing is where the response is generated depending upon the system.
Throughput
Now, how many requests can actually be sent over a network at a time? How many queries can be performed over a period of time?
To be precise, how many “things” can you process per unit time?
Think of it like water flowing through a pipe , how much water can pass through in a given time. Throughput is usually calculated with respect to time, typically per second. But not actually bound to the timings.
There’s a difference between saying:
“A server can handle 1000 MB of data” vs “A server can handle 1000 MB/sec”
Throughput depends on the firepower of the system, i.e., how well it utilizes system resources like CPU, memory, and network bandwidth within a given time.
Imagine I want to send a 5GB file across 10,000 servers, with each server has 40 Gb (5 GB) network bandwidth.
if each would take one second to transfer one file.
for 10,000 servers it would take 10,000 seconds = 2.78 hours (This is latency of a system)
which is not the ideal solution.
What are the ways to solve this problem?
- What if we use more servers to distribute the load?
- Even if you have more servers to send let's say I have 10 servers to replicate the same data and to send it through. It cut's the seconds to a less 10,000/10 seconds = 1000 seconds i.e approx 17 minuites. Still we can do more.
- Can we shard the data and send it to all the servers ?
- But the same issue occurs when sharing, let's say we shard it to 10 servers each, Each shard has to go to all machines. The same issue occurs again with transfer multiple times.
- It may accomodate a file with just 5GB, what about a 20GB file? or 100GB file ?
What is the best way?
Peer-to-Peer networks has the best optimal way to solve this problem.
Split the data file into 1000 parts (each ~5 MB) and send them to different machines randomly. Each machine starts sharing the chunks it has with others. Initially, the distribution grows exponentially as more machines participate in sharing.
But, this growth does not remain exponential due to bandwidth limits and chunk availability. Over time, the system shifts toward a more linear distribution, and the final phase slows down as the remaining chunks are propagated. Eventually, all machines receive the complete file.
To calculate it exponentially there are formulas which might do that, but it will be complex involving those. To be approximate.
at 1st second 1000 servers will have the files(but not the full file)
at 1.5th second almost 3000 servers.
at 2nd second almost 9000 servers.
to approximate that it would take 5-6secs to have the full file in all the servers.
How we could achieve this? We used the full n/w throughput or bandwidth of each server in the network.
NOTE: Everything about the calculation is theoritical, and may have different results if we run it in real systems.
The Trade-Off
The Latency and Throughpt are inversely proportional to each other, By the above example we can say when we increase the Throughput, we are eliminating the latency.
But to achieve that we should have a good system.
Each system would have it's very own requirements and trade offs.
- Streaming services like Netflix, Hotstar will consider more throughput, and a little bit of latency.
- Trading and Gaming services definitely latency optimized systems, because we need lesser latency to have the full imerssion
So Companies decide to sacrifice either of the ones to have their services running.
Read / Write ratio
Most of the applications are usually biased toward one side, and almost 90% of applications fall into one of these categories. Unless it is something like a chat application with trillions of messages every day (like WhatsApp or Discord), most systems are not equally balanced.
It is always good to identify whether your application is read-heavy or write-heavy. Some applications are more read-heavy with rare writes, and we can express this using ratios like 100:10 or 90:5 (read/write ratio).
Twitter is roughly around 90:10 (read/write), while Reddit is closer to 100:1.
Why this is important?
Since we understand the difference between reads and writes, we can choose the right components for the application more easily.
Let’s say our application has more writes (mostly inserts) and very few reads, with a ratio like 1:100. In that case, we can consider using PostgreSQL.
Why not MySQL?
Compared to PostgreSQL, MySQL is often considered more read-optimized (though PostgreSQL is also very capable). Anyway, insert-heavy workloads can sometimes be handled more efficiently in PostgreSQL depending on the use case and tuning(WAL and vaccum for updates).
To explore this further, you can check out detailed comparisons in this article.
Other Parameters
There are much more parameters that is being used to compare the load and the performance of an application. If I have to explain then it would need hours.
Infrastructure / Resource Monitoring
This is the most of the internal teams would look at if they have any issues regarding slowness of the application, to see if anything breaks. Or Enginers would look at this to optimize their code or architechture to have a better system. It requires time and effort to know why a specific parameter affect your system or not.
I will list some of the important parameters to look at with categories.
- CPU
- CPU utilization
- Time spent on Interupts
- CPU steal (If VM)
- Context switching
- no of Processes
- Memory
- Memory Utilization
- Buffer, Cache
- Dirty / commited pages counts
- Free memory
- Page swaps
- Disk
- Disk free/used
- I/O requests
- I/O bytes
- I/O PS (called as IOPS)
- I/O requests waiting
- I/O time
- Network
- Packets dropped
- Packets with error
- Bandwidth
- Recieved / Trasnmitted bytes by NIC
I may have missed some parameters, but most of the important parameters are covered. Each of them plays an important role to know and monitor the Application Load.
Real User Monitoring (RUM)
The most of the advanced applications(Obviously Netflix and streaming services) will be used to monitor the real user experience from the front end. Most of the parameters will be managed in client side rather than in the server, But it does helpful to know where the system is lagging, whether in CDN or DNS lookup or API gateway or App servers and many.
Let me list the most important parameters, you can checkout later
- Page Load time / Navigation timing
- Total time taken to load a full page in the web or app.
- Most likely to be used to discover any issues in CDN or DNS lookup
- Time to First Bye
- Total time from user clicks to until the server sends the first bytes of data
- Time to First Paint
- Time to Interactive
... And many more.